The U.S. Housing Market in June 2026: A Structural Rebalancing Amid Geopolitical and Policy Volatility
0 point by adroot1 1 month ago | flag | hide | 0 comments
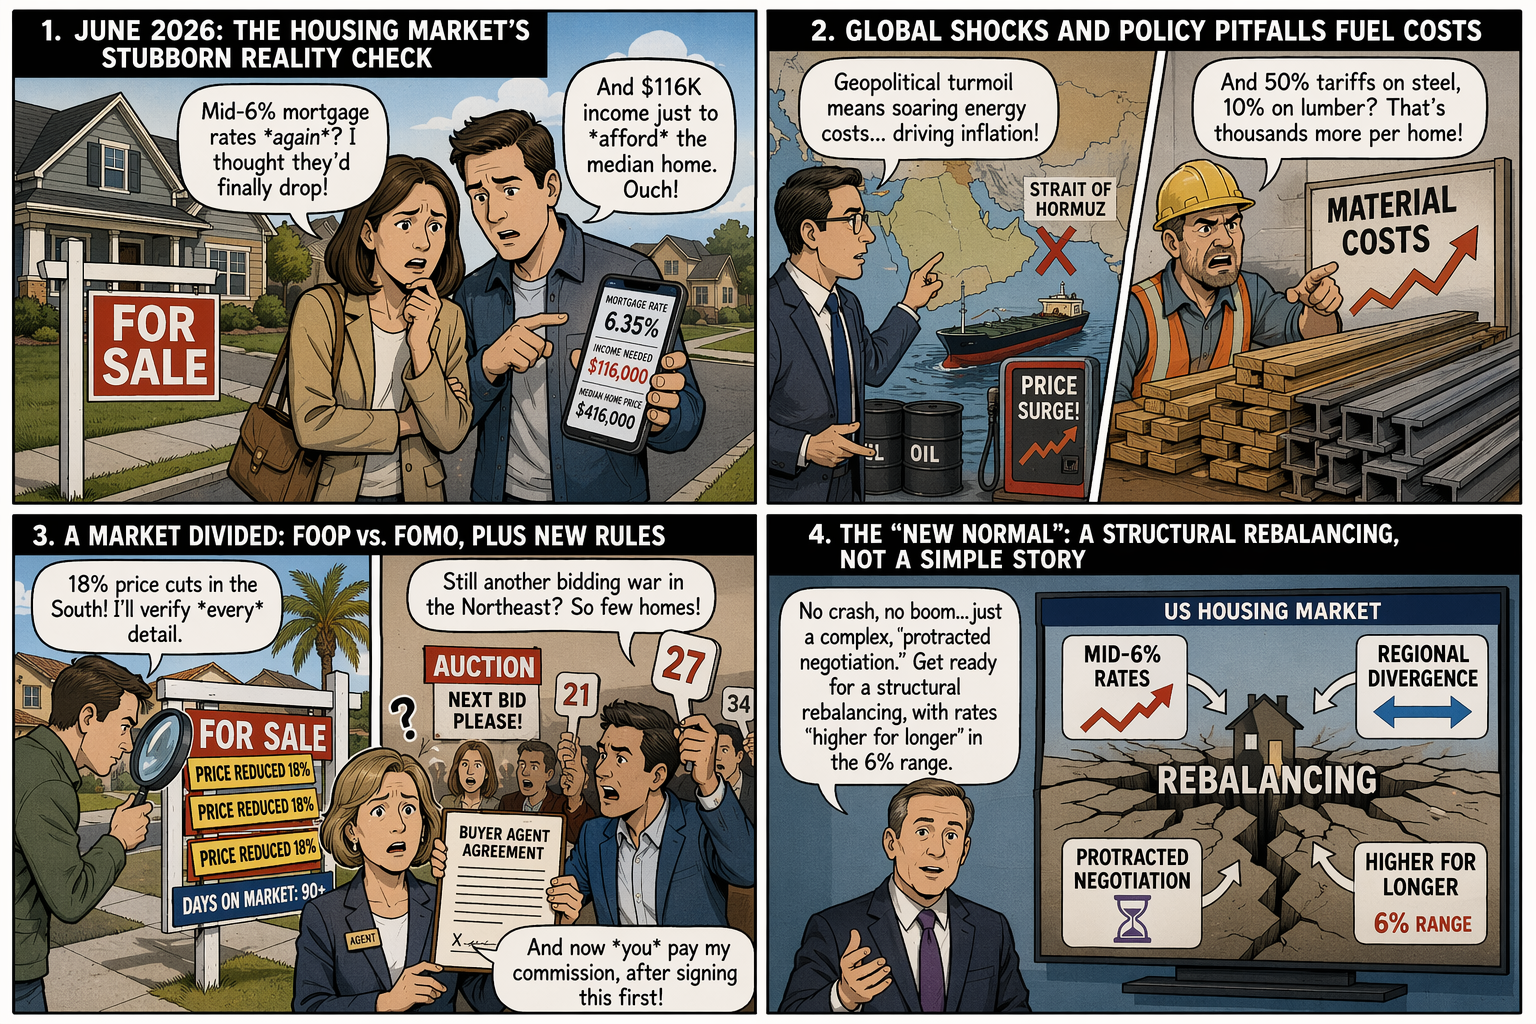
The United States housing market in June 2026 is operating within a highly complex paradigm defined by cross-currents of macroeconomic pressure, geopolitical volatility, and sweeping legislative reforms. Following years of post-pandemic whiplash, the market has entered a protracted phase of negotiation rather than rapid acceleration or catastrophic collapse. A convergence of persistent inflation, localized inventory gluts juxtaposed against regional shortages, and aggressive federal policy interventions has fundamentally altered the calculus for buyers, sellers, and builders. Mortgage rates remain stubbornly anchored in the mid-6% range, defying earlier optimistic forecasts of a return to the 5% threshold, largely due to renewed global energy disruptions [cite: 1, 2, 3, 4]. Concurrently, housing affordability remains a primary constraint, with the typical monthly payment hovering near $2,623 and requiring an annualized household income of approximately $116,780 to afford a median-priced home [cite: 5, 6].
Beneath the stagnant national averages lies a deeply bifurcated regional landscape. The Northeast and Midwest are experiencing intense competition and price appreciation due to chronic inventory shortages, while the pandemic-era boomtowns in the South and West face rising supply, extended days on market, and notable price reductions [cite: 5, 7, 8]. Furthermore, the market is currently absorbing the legal fallout of the 2024 National Association of Realtors (NAR) antitrust settlement, which has generated paradoxical effects on buyer-agent commissions and contractual obligations [cite: 9, 10]. Simultaneously, new Trump administration policies seek to reshape housing supply through aggressive tariffs, institutional investor bans, and historic cuts to the Department of Housing and Urban Development (HUD), creating significant operational and reputational ripples across the industry [cite: 11, 12, 13].
This exhaustive report deconstructs the U.S. housing market as of June 2026, analyzing consumer search behavior, macroeconomic drivers, regional variations, legal and contractual shifts, policy impacts, and product innovations. It rigorously separates verified facts from disputed claims, compares competing options and incentives, and infers probabilistic scenarios for the market's trajectory over the next eighteen months.
Consumer Sentiment and Search Behavior: The Shift to Verification and Selective Leverage
The psychology of the U.S. housing market has definitively shifted from the "fear of missing out" (FOMO) that characterized the peak pandemic years to a highly disciplined "fear of overpaying" (FOOP). Market data, consumer sentiment surveys, and search trends indicate a selective summer market where transaction volume is slowly returning, but buyers are acting with stringent financial discipline and utilizing available data to verify market conditions before committing capital [cite: 5, 14].
Consumer sentiment has deteriorated in the immediate term. According to the University of Michigan Surveys of Consumers for May 2026, sentiment fell for the third consecutive month, dropping to levels just above the historical trough seen in June 2022 [cite: 15]. The cost of living remains a first-order concern, with 57% of consumers spontaneously mentioning that high prices are eroding their personal finances, an increase from 50% in the prior month [cite: 15]. This erosion of purchasing power is particularly acute among lower-income consumers and those without college degrees, who are more sensitive to increases in the cost of gas and other essential goods driven by geopolitical conflicts [cite: 15].
In this environment, consumer search behavior reveals a distinct shift toward verification, comparison, and hyper-local data analysis. Consumers are actively bypassing national headlines to verify exact conditions in their target neighborhoods. The primary search and comparison trends dominating the market in June 2026 include the following operational and financial focal points.
The most prominent search trend involves consumers comparing hyper-local inventory data, price reduction frequencies, and specific "days on market" metrics. Buyers are actively attempting to verify whether local sellers have lost their pricing leverage. For instance, prospective buyers in the South and West are aggressively searching for homes with price cuts—which currently affect 16.1% to 18.8% of active listings in those regions—seeking to exploit seller fatigue [cite: 5, 14]. Conversely, buyers in the Northeast and Midwest are searching for negotiation strategies to win bidding wars in markets where inventory remains 37.5% to 51.6% below pre-pandemic levels [cite: 5]. This divergence in search behavior underscores that consumers no longer view the housing market as a monolith.
Following the implementation of the NAR antitrust settlement, a massive surge in search traffic is centered on verifying who pays the buyer's agent. Consumers are heavily comparing the costs of direct commission negotiation versus seeking seller concessions. Searches related to "are real estate commissions falling" and "do I have to pay my buyer agent" are trending at historic highs. Buyers are attempting to verify whether they are legally obligated to sign representation agreements before touring a home—which is now a mandatory practice under the settlement—and how to navigate off-MLS compensation offers [cite: 9, 16, 17]. This represents a profound shift in consumer operational behavior, forcing upfront contractual negotiations before any product evaluation occurs.
With the Federal Reserve maintaining its target rate through the first half of 2026, consumers are incessantly searching for macroeconomic signals that might indicate impending mortgage rate relief [cite: 2, 3]. A major comparative trend involves buyers weighing the financial incentives of new construction builder rate buydowns—which can lower effective mortgage rates by 100 to 200 basis points—against traditional financing for existing homes [cite: 18]. This search behavior demonstrates that consumers are actively seeking financial engineering solutions to bypass the constraints of the broader mortgage market.
The market is currently defined by a severe pricing standoff. Listings that are accurately priced to reflect the realities of a 6.5% mortgage rate environment are moving within 40 to 63 days, while overpriced homes are sitting stagnant for an average of 121 days [cite: 19, 20]. This substantial spread highlights a bifurcated consumer response. Sellers, observing historical equity gains, are attempting to push list prices higher, but buyers are aggressively pushing back, refusing to overextend their debt-to-income ratios. Data from market trackers indicates that listing withdrawals currently account for 22% of weekly activity, demonstrating that when seller pricing expectations fail to align with buyer purchasing power, sellers are choosing to retreat rather than capitulate to deep discounts [cite: 19].
Macroeconomic Drivers: Geopolitics, Tariffs, and the Mortgage Rate Trap
In late 2025, prevailing consensus forecasts predicted that 30-year fixed mortgage rates would decline smoothly into the mid-to-high 5% range by the middle of 2026 [cite: 3, 21]. However, June 2026 data shows rates stubbornly hovering between 6.37% and 6.6% [cite: 3, 22]. The failure of rates to materialize at lower levels is not primarily due to domestic labor market overheating, but rather severe geopolitical shocks, volatile trade policies, and persistent inflation expectations.
The U.S.-Israel-Iran conflict and the subsequent de facto closure of the Strait of Hormuz have triggered what the International Energy Agency has characterized as the largest supply disruption in the history of the global oil market [cite: 23, 24]. Because approximately 20% of the world's seaborne crude oil and liquefied natural gas (LNG) transits this narrow waterway, energy prices have surged precipitously. By late spring 2026, U.S. domestic gasoline prices spiked by 30%, reaching their highest levels since 2023, while diesel prices spiked by 50% year-over-year [cite: 4, 24].
The second-order effects of this energy crisis have deeply impacted the housing and mortgage markets. Oil and diesel power the entire construction and logistics supply chain—from the extraction of raw materials to the freight transport of lumber, appliances, and fixtures. The resulting inflationary pressure has forced the bond market to price in higher long-term inflation risks, elevating the 10-year Treasury yield to the 4.4%–4.6% range [cite: 2, 22, 25]. Because 30-year mortgage rates are priced at a spread above the 10-year Treasury yield, lenders have maintained borrowing costs in the mid-6% range. Furthermore, the mortgage-to-Treasury spread itself remains wider than its historical 1.5%–1.7% norm—currently sitting at roughly 2.0%—as lenders price in the systemic uncertainty and volatility generated by the conflict [cite: 2, 3]. Consumers correctly perceive that inflation may proliferate beyond fuel prices, with long-run inflation expectations climbing from 3.5% in April to 3.9% in May 2026 [cite: 15].
The macroeconomic volatility has created a divergence among leading institutional forecasters regarding the trajectory of mortgage rates for the remainder of 2026 and into 2027. Comparing competing interpretations provides a clearer picture of market expectations.
| Forecasting Institution | Q3 2026 Projection | Year-End 2026 Projection | 2027 Outlook | Underlying Rationale |
|---|---|---|---|---|
| Fannie Mae | 6.1% | 6.1% | 5.9% | Slowing GDP growth offset by persistent shelter inflation; rates remain above 6% [cite: 1, 3, 26]. |
| Mortgage Bankers Association (MBA) | ~6.1% | 6.0%–6.2% | ~6.5% | Expects Treasury yields and mortgage rates to stay "higher for longer" due to geopolitical and fiscal risks [cite: 3, 25]. |
| Wells Fargo | ~6.2% | 6.14% | ~6.2% | Cautious outlook anchored by elevated 10-year Treasury yields averaging 4.6% in 2027 [cite: 3, 25]. |
| Morgan Stanley | Rising | 5.75%+ | N/A | Optimistic outlier; models a temporary mid-year dip conditional on the 10-year Treasury falling to 3.75%, which markets currently view as improbable [cite: 3]. |
| Realtor.com | ~6.0% | 5.9%–6.1% | N/A | Assumes slowing economic growth and the end of quantitative tightening will eventually ease upward pressure [cite: 3, 27]. |
The prevailing consensus points toward stabilization in the low-to-mid 6% range, representing a highly durable "new normal" for borrowing costs. A return to the pandemic-era rates of 3% to 4% is widely dismissed by economic models unless a severe, systemic recession forces aggressive monetary easing [cite: 25, 26].
Compounding the inflation generated by geopolitical conflict are aggressive new trade policies implemented by the Trump administration. The introduction of sweeping tariffs—including a 50% tariff on steel mill products, copper, and aluminum, alongside a 10% blanket tariff on softwood lumber—has severely impacted the cost basis for residential construction [cite: 28]. The Joint Economic Committee and the Center for American Progress estimate that these tariffs add an initial $10,900 to $17,500 in hard costs to every new home constructed [cite: 12, 28]. By 2028, if homebuilding volumes fall as projected, the tariff-induced cost penalty could rise to $18,500 per home [cite: 28].
These tariffs create a systemic operational headwind for the industry. While builders recognize the consumer demand for smaller, more affordable starter homes, rising input prices compress developer margins. To maintain profitability, builders are forced to pass these costs onto consumers through higher list prices, or they must abandon marginal projects altogether. Projections suggest these tariffs could result in 450,000 fewer new homes being built through 2030, actively counteracting the nation's efforts to solve its severe housing supply deficit [cite: 28]. In January 2026 alone, nonresidential construction input prices surged at a blistering annualized rate of 7.1%, largely driven by tariff-affected materials [cite: 29].
Diagnosing the Housing Shortage: Verified Facts vs. Disputed Claims
A central debate defining the U.S. housing market in 2026 revolves around the true nature, scale, and permanence of the housing shortage. As the market experiences a prolonged period of low sales volume and stubbornly high prices, economists and policymakers offer competing explanations. Estimates regarding the national housing deficit vary wildly, with Moody's projecting a 2 million unit gap, Realtor.com calculating a 4.03 million gap, McKinsey projecting 8.2 million, and certain political figures citing figures as high as 20 million [cite: 30, 31]. It is critical to separate verified structural facts from disputed cyclical claims.
Verified Fact: The Structural Deficit is Expanding According to Realtor.com's 2026 Housing Supply Gap Report, the U.S. experienced approximately 1.41 million new household formations in 2025 against only 1.36 million housing starts. This resulted in the market falling behind by an additional 50,000 units in a single year, pushing the total estimated supply gap to 4.03 million homes, up from 3.8 million in 2024 [cite: 30]. This is a verifiable, structural mismatch. Following the 2008 Great Financial Crisis, the U.S. residential construction sector severely underbuilt for over a decade. Analysts estimate that roughly 1.82 million millennial and Gen Z households were "missing" in 2025, meaning they delayed forming independent households due to a lack of affordable inventory [cite: 30]. Furthermore, J.P. Morgan estimates that even at elevated production levels, it will take almost 10 years to fully address this construction backlog [cite: 32]. This structural reality implies that the market cannot simply "wait out" the current conditions; high baseline property values are effectively insulated against a severe crash by demographic demand colliding with physical scarcity [cite: 32, 33].
Disputed Claim: The Housing Shortage is a Myth Driven by Square Footage Expectations A competing interpretation, championed by some contrarian economists, argues that there is no true numerical shortage of dwelling units. This argument posits that if modern U.S. households accepted the square-footage expectations of the 1990s, the nation would actually possess a surplus of up to 40 million homes [cite: 31]. Proponents of this view also point to the existence of 3.4 million vacant homes across the country as evidence of sufficient supply [cite: 31].
Plausible Inference and Synthesis While it is factually true that the U.S. has vacant homes, the "surplus" argument is fundamentally flawed because it ignores geographic and economic utility. Vacant housing stock concentrated in decaying rural towns or economically depressed regions does not solve the acute supply crises in dynamic, high-growth job centers. Furthermore, while the average footprint of a home has grown, household sizes have shrunk, altering the functional utility of the existing stock. The most plausible inference is that the U.S. faces a severe, structural shortage of habitable, affordable homes in locations where employment and economic opportunity exist. Even under highly optimistic building scenarios, analysts warn that sustained and targeted increases in housing supply are necessary to reverse a deficit that compounds annually [cite: 30].
Regional Variations: The Great Bifurcation of the American Housing Market
The concept of a singular, monolithic "U.S. housing market" is fundamentally obsolete in June 2026. Data reveals a dramatic and accelerating divergence in equity growth, inventory levels, and buyer leverage across geographic lines, necessitating hyper-local strategies for consumers and real estate professionals alike.
The strongest and hottest housing markets in 2026 are overwhelmingly concentrated in the Northeast and Midwest. Cities such as Hartford, CT; Buffalo, NY; Rochester, NY; and Providence, RI are experiencing robust, sustained seller's markets that defy the national narrative of stagnation [cite: 7, 8, 34].
The primary driver of this strength is a chronic, severe lack of inventory. Active listings in the Northeast remain 51.6% below pre-pandemic levels, while the Midwest sits 37.5% below [cite: 5]. Despite mortgage rates resting in the mid-6% range, this extreme supply constraint, combined with relatively lower median list prices (e.g., Buffalo at a typical home value of $277,499), makes these markets highly attractive. They serve as "refuge markets" for first-time buyers and professionals relocating from ultra-high-cost coastal hubs [cite: 8, 34]. Consequently, bidding wars remain common. In 2025, 66% of homes in Hartford and 65% in Buffalo sold above their asking prices, and home values in these metros are forecast to rise an additional 2.5% to 3.9% in 2026 [cite: 34].
Conversely, the pandemic-era boomtowns across the South and West are experiencing a significant cooling phase and localized price corrections. Zillow has officially downgraded its 2027 housing market forecast into negative territory for 27 of the top 50 metropolitan areas, specifically targeting high-inventory cities such as Austin, TX; Phoenix, AZ; San Francisco, CA; and Portland, OR [cite: 35].
Between 2020 and 2023, these regions experienced massive speculative building, intense investor influxes, and rapid population migration. As migration slowed and affordability hit a hard ceiling, inventory began to accumulate rapidly. The result is a sharp shift in negotiating leverage. The South currently reports the highest share of price cuts in the nation at 18.8%, with states like Tennessee and South Carolina seeing price cuts on 26% to 27% of all active listings [cite: 5, 35]. Sellers who purchased at the peak of the 2022 pricing bubble are taking notable capital losses. Market reports track specific properties in Florida and Atlanta selling for $140,000 to $165,000 below their previous peak purchase prices, signaling that localized corrections of 15% to 20% are occurring on a property-by-property basis [cite: 35].
To further illustrate this geographic divergence, the table below compares metrics across a sample of prominent U.S. markets for 2026, combining inventory shortages with home value growth trajectories.
| Metropolitan Area | Region | Typical Home Value | Inventory vs. Pre-Pandemic | % Sold Above Asking (2025) | Projected 2026 Price Growth |
|---|---|---|---|---|---|
| Hartford, CT | Northeast | $381,760 | -63.0% | 66.0% | +3.9% [cite: 34] |
| Providence, RI | Northeast | $503,409 | -55.0% | 50.0% | +3.0% [cite: 34] |
| Buffalo, NY | Northeast | $277,499 | -39.1% | 65.0% | +2.5% [cite: 34] |
| Richmond, VA | South | $383,275 | -34.0% | 40.5% | +2.1% [cite: 34] |
| Jacksonville, FL | South | $342,853 | Rising | N/A | +1.5% [cite: 36] |
| New York, NY | Northeast | $704,284 | -48.0% | 49.0% | +1.5% [cite: 34] |
Legal and Contractual Upheaval: The NAR Settlement Reality
In August 2024, the National Association of Realtors (NAR) implemented historic business practice changes following a massive $418 million antitrust settlement [cite: 17]. By June 2026, the real-world operational, financial, and reputational impacts of this settlement can be rigorously evaluated against initial consumer and industry expectations.
Disputed Claim: Initial consumer expectations and media narratives predicted that the settlement would cause buyer-agent commissions to collapse, potentially to zero, as mandatory MLS compensation offers were eliminated, saving homebuyers thousands of dollars. Verified Fact: Commissions have proven highly "sticky" and have, paradoxically, risen slightly. According to Redfin data, the national average buyer-agent commission climbed from 2.38% prior to the lawsuit to 2.43% by mid-2025 [cite: 10]. Furthermore, industry surveys conducted in March 2026 indicate that roughly two-thirds of real estate agents report no significant shift in overall commission levels [cite: 17].
Operational Mechanism: The persistence of these commissions is rooted in market leverage and buyer liquidity constraints. In a high-interest-rate environment where buyers are already cash-strapped attempting to cover down payments and inflated closing costs, very few possess the liquid capital to pay a 2% to 3% buyer-agent fee entirely out of pocket. Consequently, to make their homes attractive and accessible to the widest possible pool of buyers, sellers overwhelmingly continue to offer buyer-broker compensation [cite: 10, 17]. The mechanism of payment has simply shifted from an automatic, advertised MLS field to a highly negotiated seller concession written directly into the purchase contract [cite: 9, 16, 17].
The settlement mandated that agents execute a written buyer representation agreement detailing exact compensation before touring any home [cite: 9, 17]. This has introduced significant operational friction into the consumer experience. While 67% of the general public conceptually supports the transparent decoupling of commissions, an overwhelming 70% of real estate agents oppose the new rules, arguing that they harm first-time homebuyers and elongate the sales cycle [cite: 37].
This contractual friction has resulted in major legislative and judicial pushback in 2026:
- State Legislative Overrides: States including Mississippi and Alabama have passed controversial laws explicitly stating that buyer agents and brokers are not required to obtain signed agreements prior to touring a property, creating a direct legal and regulatory conflict with NAR's national settlement mandate [cite: 38].
- Aggressive Litigation and Enforcement: Where agreements are signed, brokerages are beginning to ruthlessly enforce them. In a landmark case in Miami-Dade County, Florida, a jury awarded a brokerage $47.8 million in punitive and compensatory damages after a buyer breached a representation agreement to purchase a $2.8 million property through another entity [cite: 39]. In a separate, more typical arbitration case, a buyer was ordered to pay $24,000 to their original broker after utilizing a different agent to close a transaction, despite signing an exclusive agreement [cite: 40]. These rulings confirm that buyer agreements in 2026 contain formidable legal teeth, shifting significant liability onto the consumer.
Federal Policy Shockwaves: The Trump Administration’s Housing Agenda
In 2026, the Trump administration enacted multiple sweeping policies aimed at altering the trajectory of the U.S. housing market. An analysis of administrative, legal, and operational factors reveals complex, highly disruptive, and sometimes contradictory outcomes.
Through executive orders and congressional lobbying—such as the 21st Century ROAD to Housing Act—the administration has sought to ban or severely restrict large institutional investors (defined as those owning 350 to 1,000+ single-family homes) from purchasing additional inventory [cite: 11, 41, 42]. The stated political goal is to stop corporate entities from competing with "Main Street" homebuyers and to drive down prices [cite: 11, 42].
Fact-Checking the Policy Impact: Leading economists from the Urban Institute, Brookings Institution, and Yale University widely dispute the efficacy of this policy for improving affordability [cite: 41, 43, 44, 45]. Verified data demonstrates that institutional investors own less than 0.5% of the total U.S. single-family housing stock, and roughly 3% of all single-family rentals [cite: 41, 44]. The vast majority of investor purchases (accounting for up to 24% of the market) are actually driven by small "mom-and-pop" investors who own between 1 and 9 properties [cite: 42, 44].
Plausible Inference: Removing institutional buyers will not cause a systemic, nationwide drop in home prices. However, it carries significant negative ripple effects for the rental market. By choking off institutional capital, the production of new "build-to-rent" communities is stalling. This artificially reduces the future supply of single-family rentals, driving up lease rates for families who cannot qualify for 6.5% mortgages [cite: 11, 43]. Paradoxically, barring institutional competition may simply provide small mom-and-pop investors easier access to starter homes, ensuring that first-time homebuyers continue to be crowded out of the market [cite: 44].
To artificially depress borrowing costs, the administration instructed Fannie Mae and Freddie Mac to purchase up to $200 billion in mortgage-backed securities (MBS) [cite: 18]. Research from J.P. Morgan indicates this move is largely symbolic. The $200 billion figure represents only about 1.4% of the estimated $14.5 trillion U.S. mortgage market [cite: 18]. Operational models predict this policy lowers the 30-year fixed rate by a negligible 10 to 15 basis points—an effect entirely eclipsed by the upward rate pressure generated by global energy inflation. Furthermore, it fails to compete with the 100 to 200 basis point buydowns already being offered directly by major homebuilders [cite: 18].
Perhaps the most consequential administrative action is the Trump administration's FY2026 budget, which proposes an unprecedented 44% reduction in HUD funding, stripping roughly $26.7 billion from federal housing programs [cite: 46, 47]. The proposal seeks to eliminate the HOME Investment Partnership and Community Development Block Grant (CDBG) programs, and consolidate Section 8 vouchers, Public Housing, and supportive programs for the elderly and disabled into a single "State Rental Assistance Block Grant" (SRABG) [cite: 13, 47, 48].
Most controversially, the budget imposes a strict 2-year time limit on rental assistance for non-elderly, non-disabled households [cite: 13, 47]. Housing advocacy groups, including the National Low Income Housing Coalition (NLIHC), warn this represents a systemic dismantling of the affordable housing safety net. In high-density, high-cost markets like New York—where up to 200,000 households could be subjected to these new term limits—the enforcement risks triggering mass evictions, widespread homelessness, and subsequent defaults on multifamily mortgages [cite: 13]. Additionally, slashing Continuum of Care (CoC) funding jeopardizes permanent supportive housing for roughly 170,000 individuals [cite: 49]. The reputational and humanitarian fallout from these policies is expected to be severe, placing immense operational strain on state and municipal governments forced to absorb the displaced populations.
Product Evolution: The Commercialization of 3D-Printed Housing
Faced with a 4 million+ unit deficit, chronic labor shortages (with nearly 300,000 unfilled construction jobs), a shifting consumer preference for smaller footprints, and punitive tariffs on traditional lumber and steel, the residential construction industry in 2026 is aggressively transitioning toward industrialized additive manufacturing—specifically, 3D concrete printing (3DCP) [cite: 30, 50, 51, 52, 53].
By 2026, 3D printing has evolved from experimental prototypes to community-scale subdivision deployments [cite: 54]. While the initial capital expenditure for a large-scale gantry 3D printer remains high (ranging from $800,000 to $1.5 million), the unit economics are highly compelling for well-capitalized developers [cite: 52]. The replacement of skilled framing labor with robotic extrusion, combined with zero-waste material usage, results in dramatic operational cost reductions [cite: 52, 55].
Financial models indicate that in 2026, a 3D-printed 4-bedroom home costs approximately $390,000 to build, representing a 22% savings compared to a $500,000 traditional stick-built home in markets like Georgia [cite: 52]. Driven by local material sourcing, economies of scale, and the establishment of specialized vocational training for 3D technicians, the cost of a 3D-printed home is projected to fall to roughly $301,774 by 2031. Conversely, inflation is expected to drive traditional builds up to $579,638 over the same period, yielding a staggering 48% cost advantage for 3D-printed housing [cite: 52]. For builders, maintaining high utilization of these machines yields exceptional EBITDA margins, sometimes targeting above 86% as massive fixed costs are absorbed across high-volume production [cite: 56]. This technology serves as the industry's primary operational hedge against policy-induced material inflation and the ongoing affordability crisis.
Probabilistic Scenarios and Market Outlook
The U.S. housing market in June 2026 is governed by a delicate, highly negotiated standoff. Affordability is heavily constrained by historically high prices and persistent mid-6% mortgage rates, yet national prices refuse to crash broadly due to a deeply entrenched structural supply deficit. Based on the convergence of macroeconomic data, geopolitical risk, and federal policy execution, three distinct scenarios emerge for the trajectory of the housing market over the next eighteen months.
Scenario 1: The "Higher for Longer" Stagnation (Base Case - 65% Probability) The Strait of Hormuz conflict persists as a slow-burn geopolitical crisis, maintaining elevated diesel, freight, and supply chain costs. Consequently, the 10-year Treasury yield remains near the 4.5% threshold, keeping 30-year mortgage rates trapped between 6.0% and 6.5% through the end of 2027. National home prices remain effectively flat—experiencing 0% to +1.2% nominal growth—which results in a slight decline in real, inflation-adjusted terms, offering a slow, grinding path to affordability [cite: 18, 57]. Transaction volume recovers only marginally to roughly 4.2 million annualized existing-home sales [cite: 58]. The market remains heavily supported by builder incentives and new construction buydowns, while existing homeowners remain locked in by sub-4% legacy mortgages, perpetuating the supply shortage in high-demand metros.
Scenario 2: The Stagflation Correction (Bear Case - 20% Probability) Geopolitical conflicts escalate further, forcing crude oil and domestic gasoline to historic highs and driving U.S. headline inflation back above 4%. The Federal Reserve is forced to abandon its holding pattern and resume rate hikes, pushing mortgage rates back above 7.5%. Simultaneously, the strict implementation of heavy tariffs stifles new residential construction, exacerbating the physical housing shortage, while the 44% cuts to the HUD budget trigger rising eviction rates and distressed multi-family property sales across major urban centers. In this scenario, heavily supplied Sunbelt markets (e.g., Austin, Phoenix, Florida) experience nominal price crashes of 10% to 15% as inventory overwhelms diminished buyer demand, while the broader national market plunges back into a deep, recessionary transaction freeze.
Scenario 3: The Affordability Unlock (Bull Case - 15% Probability) A swift diplomatic resolution secures the Strait of Hormuz, rapidly collapsing the geopolitical risk premium on oil and allowing domestic inflation to cool decisively. The 10-year Treasury yield falls below 3.8%, allowing mortgage rates to dip into the high-5% range by late 2026. This sudden rate relief unlocks massive pent-up demand from the 1.8 million "missing" millennial and Gen Z households waiting on the sidelines. Builders successfully leverage the scale of 3D printing and normalized supply chains to ramp up production, bypassing tariff constraints. This results in a healthy, balanced market yielding closer to 4.8 million existing-home sales and moderate, sustainable price appreciation across all regional sectors.
In the immediate term, buyers, sellers, and industry professionals must navigate a hyper-local, highly negotiated environment where federal policies, strict legal liabilities from buyer representation agreements, and global energy dynamics dictate local pricing power.
Sources:
- rocketmortgage.com
- noradarealestate.com
- realcostreport.com
- theguardian.com
- reddit.com
- redfin.com
- mckissock.com
- realtor.com
- 1percentlists.com
- foxessellfaster.com
- nationalmortgageprofessional.com
- senate.gov
- thenyhc.org
- reddit.com
- umich.edu
- youtube.com
- ownluxuryhomes.com
- jpmorgan.com
- housingwire.com
- youtube.com
- benchmark.us
- noradarealestate.com
- imf.org
- wikipedia.org
- fastcompany.com
- theadvantagelending.com
- realtor.com
- americanprogress.org
- constructiondive.com
- nationalmortgageprofessional.com
- washingtonpost.com
- nadlancapitalgroup.com
- 1strespondernews.com
- zillow.com
- youtube.com
- noradarealestate.com
- housingwire.com
- housingwire.com
- housingwire.com
- housingwire.com
- urban.org
- miami.edu
- brookings.edu
- yale.edu
- washu.edu
- bipartisanpolicy.org
- nlihc.org
- enterprisecommunity.org
- endhomelessness.org
- jbrec.com
- mashouse.es
- [evorelic.com](https://vertexaisearch.cloud.google.com/grounding-api-redirect/AUZIYQHO236lRbTg63q1jk9wc_Qu217w8uv427O01gm5NaAH4xv43HrIkmjCMSxHyCNYYC3EgQwJBDjivkxPIjuKoiqRAwPPNk31OtIWijDn7WmzJP6BQd9dDZVradg-JuVw6m1-N6sFWBWvU9cQqbHBEct1m2gTkTasly8EIS7Jk0nJX3CLD7v0okNgPLGKqzcsoagGJsDUV2EQEm_RbNFhxBRGJQgxcsgbInEwI0fYpyqff-YBRjvWwWv9M9LsEiosHMRYzyhXXtatKiXrtdhencWWBXCC1PDa5s5itTdAD0aklK████████ [private endpoint removed]
- nahb.org
- persistencemarketresearch.com
- wealthformula.com
- financialmodelslab.com
- zillow.com
- edgerealtyintl.com